
21·
1 day agoIt turns out many of us do search for specific terms when we want specific items.
It turns out many of us do search for specific terms when we want specific items.
I’ve only read your comment so far, but I thought it was obvious enough to be surprised your comment was in top
When you say trends, is it among people not baking long enough? I love gooey cookies as well, but that looks raw.
Recently I used store made cookie dough (because “safe to eat raw”!) in a cast iron pan to make it more like a brownie, maybe like this. Surprise, it’s much thicker than a standard cookie so needs to be cooked longer than the directions say
But one of the points is those big stars don’t just happen to be white. Throughout the years, a variety of conditions made it more likely that big stars would be white. Continuing to cast them for their star power instead of fitness for source, is pretty much the definition of “systemic racism”
Those people will tell you they’re not racist, that’s why there is no systemic racism. They think you are being racist for singling that out when there was none. Could it be a large part denial, lack of awareness? Or is that just a claim to explain their outrage?
Marketing does matter. For whatever reason, they interpret “all X matter” as “only X matters”, and “X matters too” is not a memorable phrase
People made a big deal over Sean Connery in The Highlander, although no one was really offended. It was just another joke
Wasn’t it not just the casting of one character, but that they recast the movie to be all black? When I see something that looks like “recast the movie to be X”, I don’t expect very much and usually don’t bother watching. If this was one my favorite movies, I can see being upset that they would remake it just for race or gender (although now that I mention that, it could be hilarious to remake for gender)
That includes “recast the movie to be white”, now that we’re getting lots of well done videos that don’t start as white.
But I suppose it’s white privilege that I never saw an issue with most of these (but wtf, Johnny Depp?). They’re close enough and generally the character is not written overly specific anyway. Ms Marvel must be correct because the entire movie was based on her culture, ethnicity, history. If the movie was written about “generic American teenager” declared to be something other than white, would we care? Should we? Meanwhile, who cares about Scarlet Witch? Aside from”European”, there was nothing in the movie to make her anything specific. From the post about the comics, the source material is horribly muddled

Huh. It’s like a bidet, but worse
They’re not going anymore, they’re sitting there arguing over who has to go get some toilet paper
Sorry to hijack your thread, @Lost_My_Mind …
Wish y’all could have made it. All My guests did come, but there was a ton of food and a lot leftover


Boston. I’m serious too
Oh man, I did not need to read this now ……
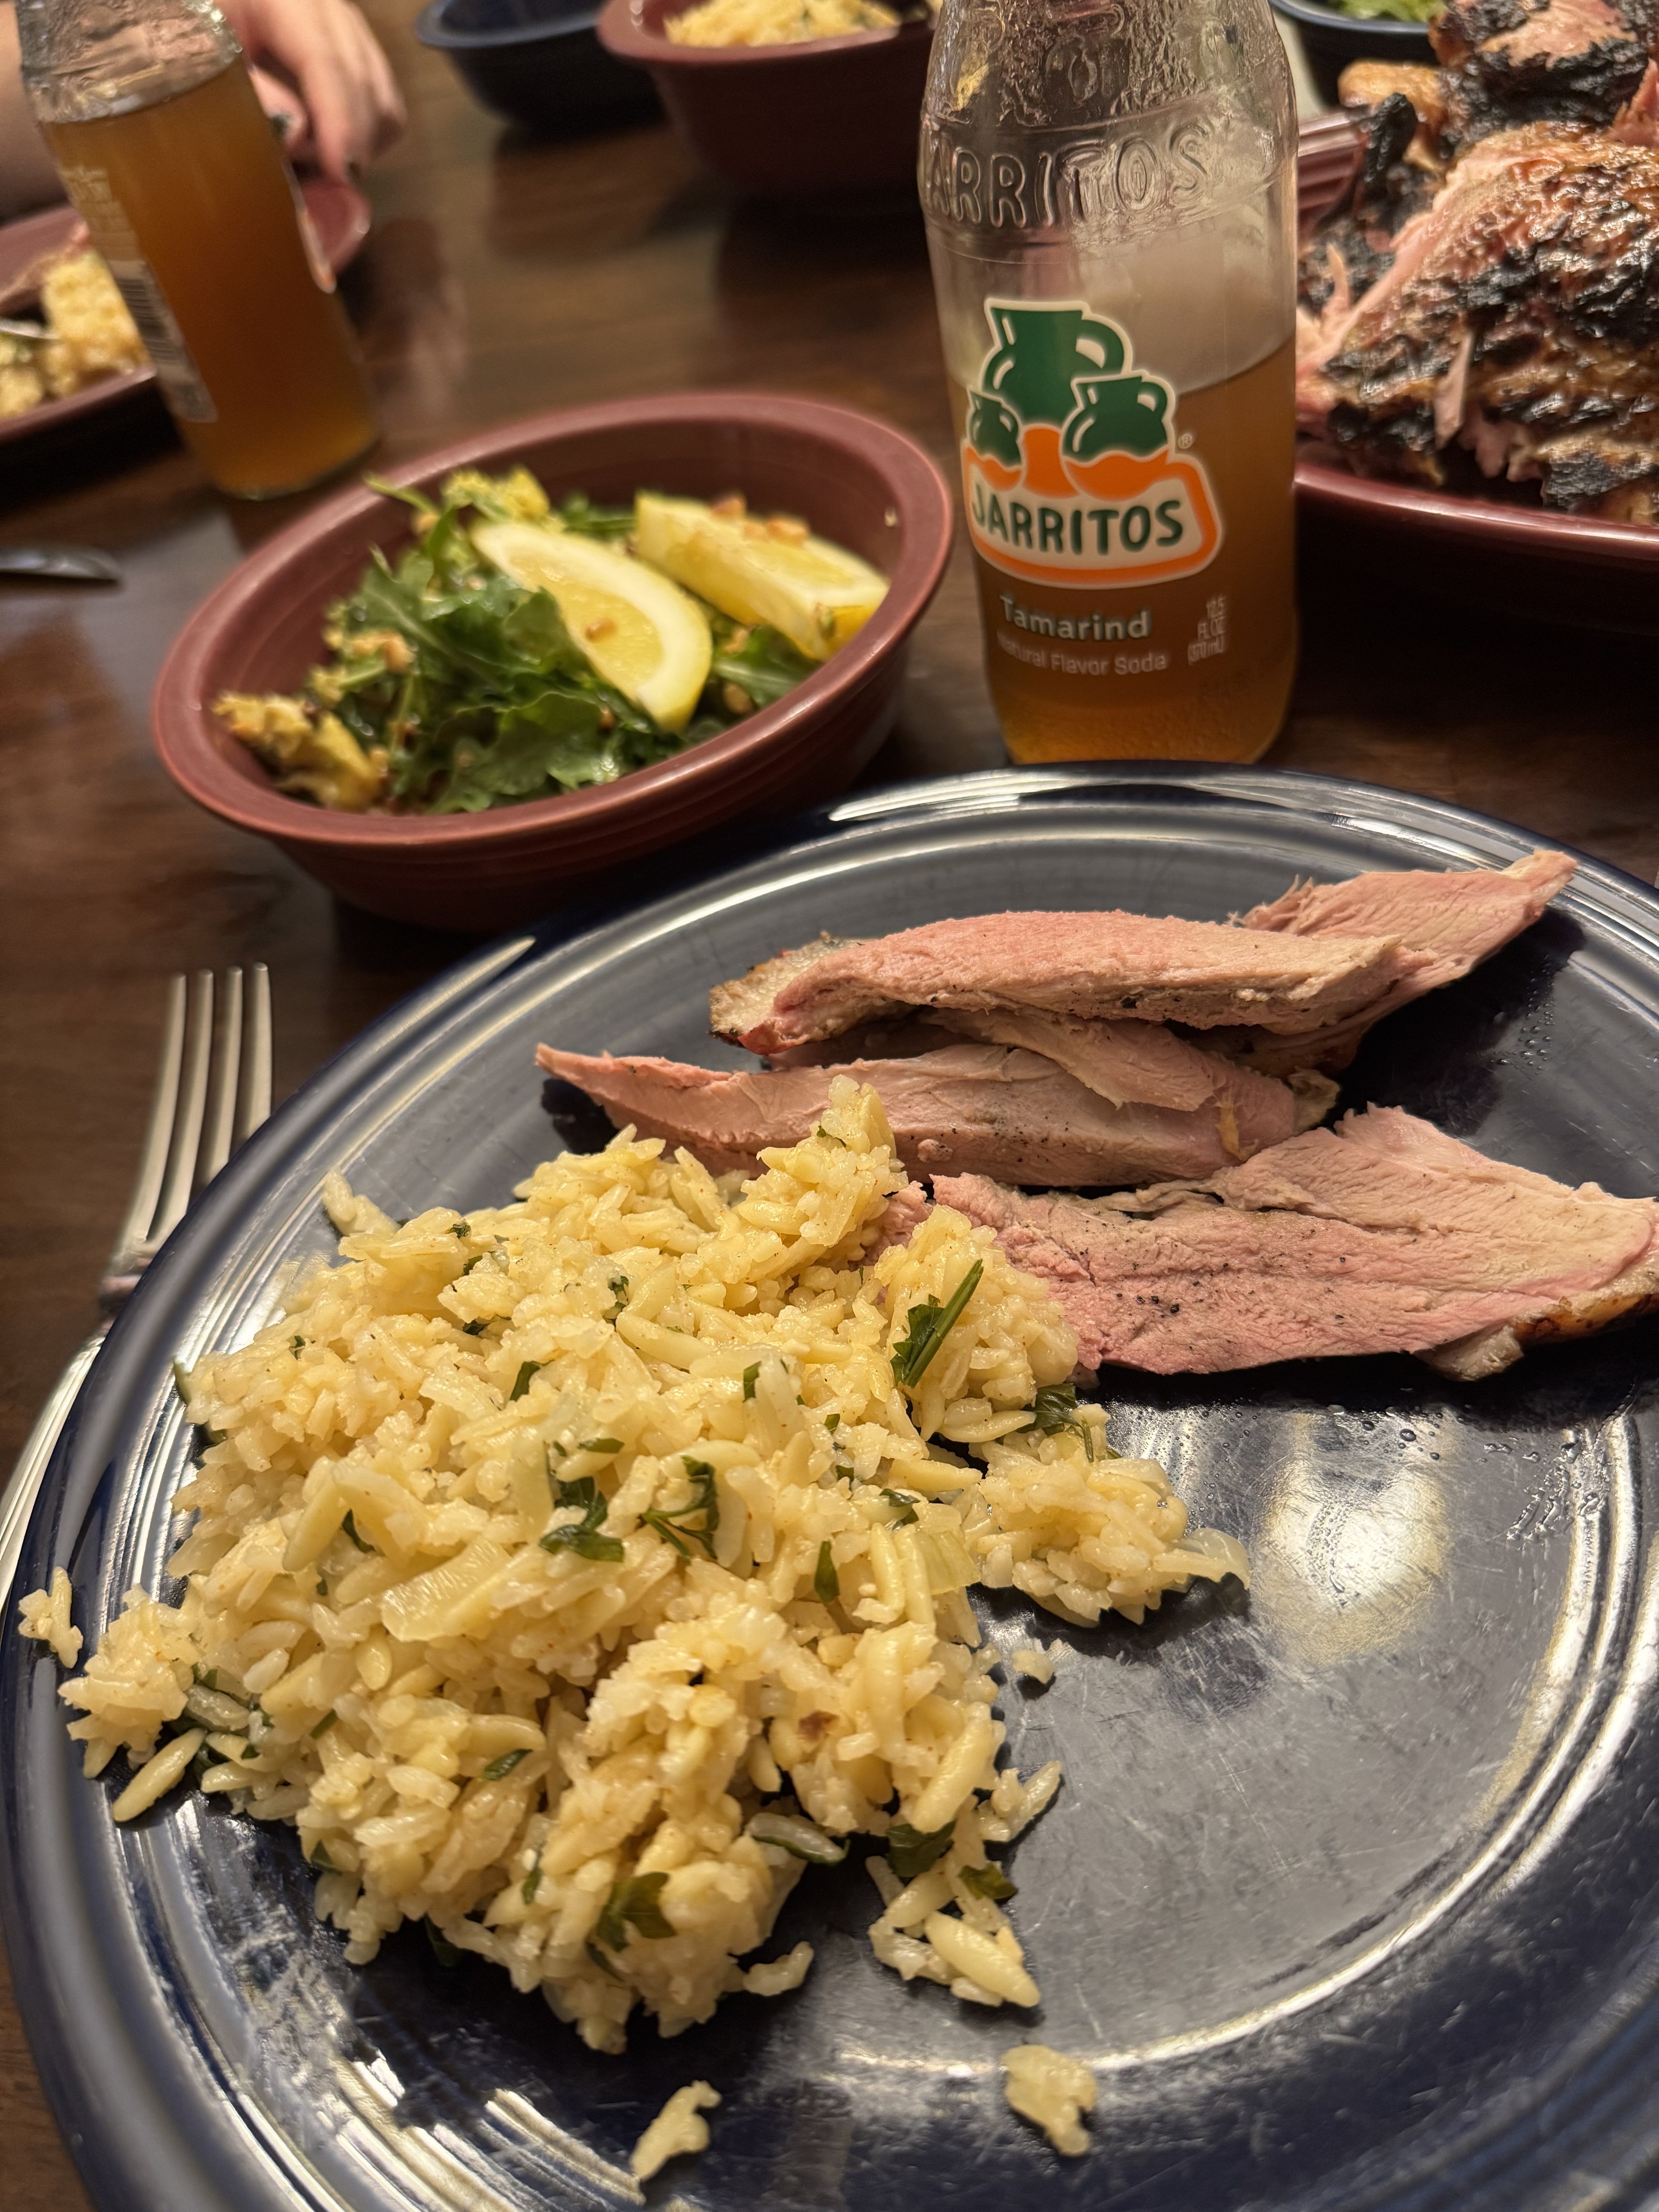
I have people coming over today. They cancelled on a previous weekend and are hemming and hawing. The event is that I have a smoker and and want to make all kinds of new foods. I have $100 of meat, an elaborate salad and sides. Dessert also goes on the smoker. I just want someone to help eat.
This weekend’s feast is duck. Dry brined, stuffed with oranges, and smoked. Or chicken, to bribe a picky eater to come.
But it’s cold and rainy so the outdoor seating is out and I don’t really have space inside . I have an afternoon of cooking ahead that I was so excited for but have lost my motivation, dreading wasted time and money if they don’t show up

Why not both? More automation is definitely cool, but also make the door work better for you. I hate that style of lock
First thing I did when I moved into my current home is to replace deadbolt with a key inside with a standard deadbolt with an inside knob
The Wikipedia article on animal consciousness has an interesting discussion
Of particular note as I sit here petting my dog, is the example of self-awareness in dogs. Historically dogs don’t seem to exhibit self-awareness, but we used a mirror test and dogs aren’t as visual. A sniff test, using their dominant sense, shows they are
Thanks for the fascinating rabbit hole …. Popping my head back up: it seems like no. It actually reminds me a lot of the term “artificial intelligence” where every time it’s demonstrated, the definition changes. So the question really is whether we move the goalposts or whether we just define the intended meaning poorly.
To me it looks like both terms have an implied “like a human” that has not yet been met. When an animal achieves the definition of sapient, it’s the definition that’s wrong because accepted use implies “like a human”.
And of course the real answer in both cases is to use more precise terms. That’s where things get really interesting
If an alien can travel to meet us, and we have nowhere near the technology that we could travel to them, then yes they are far beyond our level of technology.
Since the question mentioned “civilization”, these are sapient beings, not just microbes or animals of some sort. While there’s still a chance of primitive life in our solar system, sapient life pretty much implies travel from outside the solar system and we can only do that in our fiction
That makes A great movie plot but it seems awfully far fetched , even in the reality where aliens visit us


One of the points here was those syntaxes no longer work
I’m currently looking for a new light fixture and haven’t yet found the magical search phrase to get there or a site with filtering that works. Of course it may not exist but all my attempted searches so far return random junk, so I don’t even know